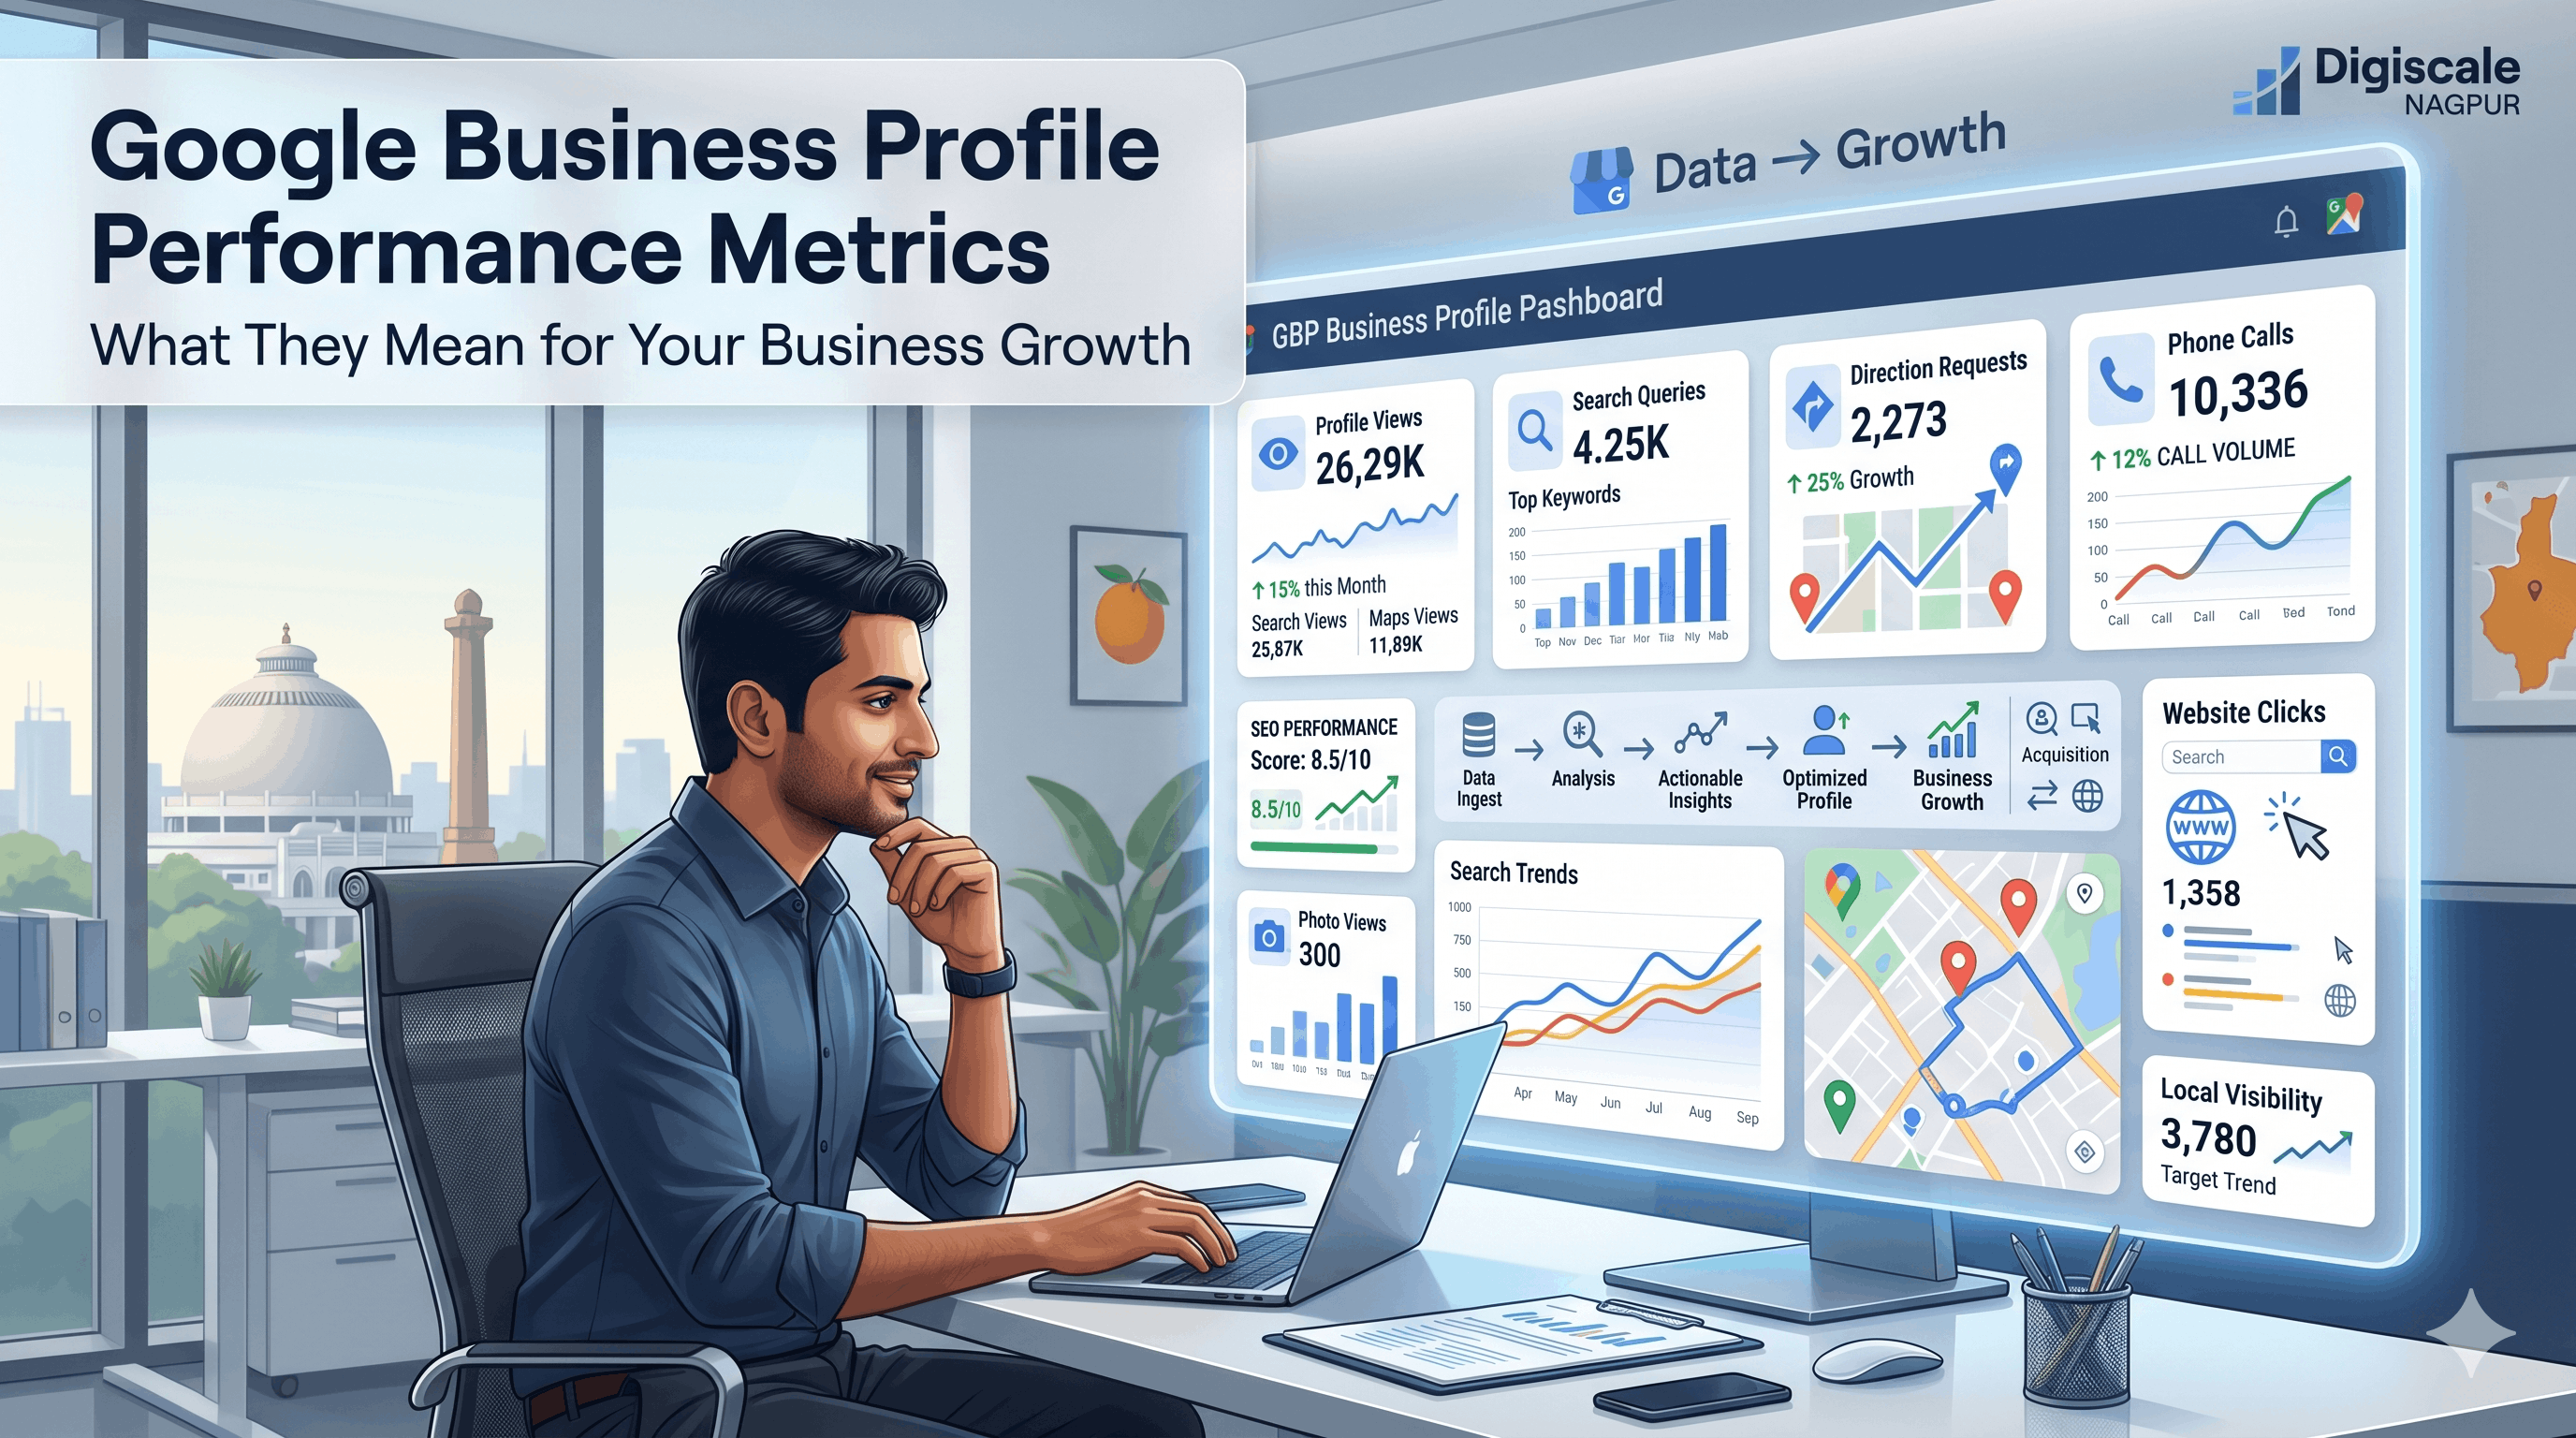
Google Business Profile Performance Metrics — What They Mean for Your Nagpur Business
🚀 The Dashboard Nobody Is Reading — And What It Is Costing Nagpur Businesses
Ramesh owns a mid-sized gym in Ramdaspeth. He has been running it for four years and has a Google Business Profile that was set up by a friend when the gym opened. He checks Google occasionally to see if new reviews have come in. He has never once opened the Performance section of his Business Profile.
He is not unusual. The overwhelming majority of business owners in Nagpur with a Google Business Profile have never looked at the performance data sitting inside it. This data shows how many people found the business on Google this week, whether they found it through a direct name search or a category search, how many people requested directions, how many people clicked to call, and how many people visited the website.
All of this information is available for free, right there inside the profile. And it is one of the most powerful tools available for understanding how your business actually performs in Nagpur's local search market.
This guide explains what every metric means, how to interpret the numbers, and how to use the data to make decisions that improve your Google rankings and bring more customers through your door.
🎯 The Six Core Metrics in Google Business Profile Performance
1. Business Profile Views
This metric tells you how many times your Business Profile appeared in Google Search or Google Maps within a given period. It is split into two categories: views from Search and views from Maps.
What this tells you:
A high Search views number relative to Maps views means customers are finding you by name or by the specific terms you rank for. A high Maps views number indicates strong local discovery, meaning people in your area are finding you while browsing the map or searching location-based queries.
What to do with it:
Track this number week over week. If it is declining, your profile's relevance or prominence signals are weakening — possibly because competitors are outpacing your activity. If it is growing, the optimization efforts are working.
2. Search Queries Used to Find Your Business
This is the most strategically valuable data in the Performance section. It shows you exactly what people typed into Google before finding your profile.
In practice, this reveals two distinct groups. Direct searches are queries that include your business name — people who already know you exist. Discovery searches are category or service queries such as "restaurant in Sitabuldi," "dentist in Nagpur," or "best gym near me."
Discovery searches represent new customers who did not know about you before finding your listing.
What to do with it:
If your discovery search volume is low, it means Google does not yet consider your business relevant enough for category queries. This is where optimization of categories, description, posts, and reviews has the biggest impact.
If discovery searches are high but conversions such as calls and direction requests are low, the profile itself is not compelling enough once people find it. Photos, reviews, and the virtual tour need attention.
3. Direction Requests
This is the number of times people clicked "Get directions" from your Business Profile. It is one of the strongest intent signals available in the data because it means someone has moved from browsing to actively planning to visit you.
What this tells you:
A high direction request number relative to your profile views indicates strong conversion. People who find you decide to come.
A low ratio suggests the profile is not convincing people to take action even after they find you.
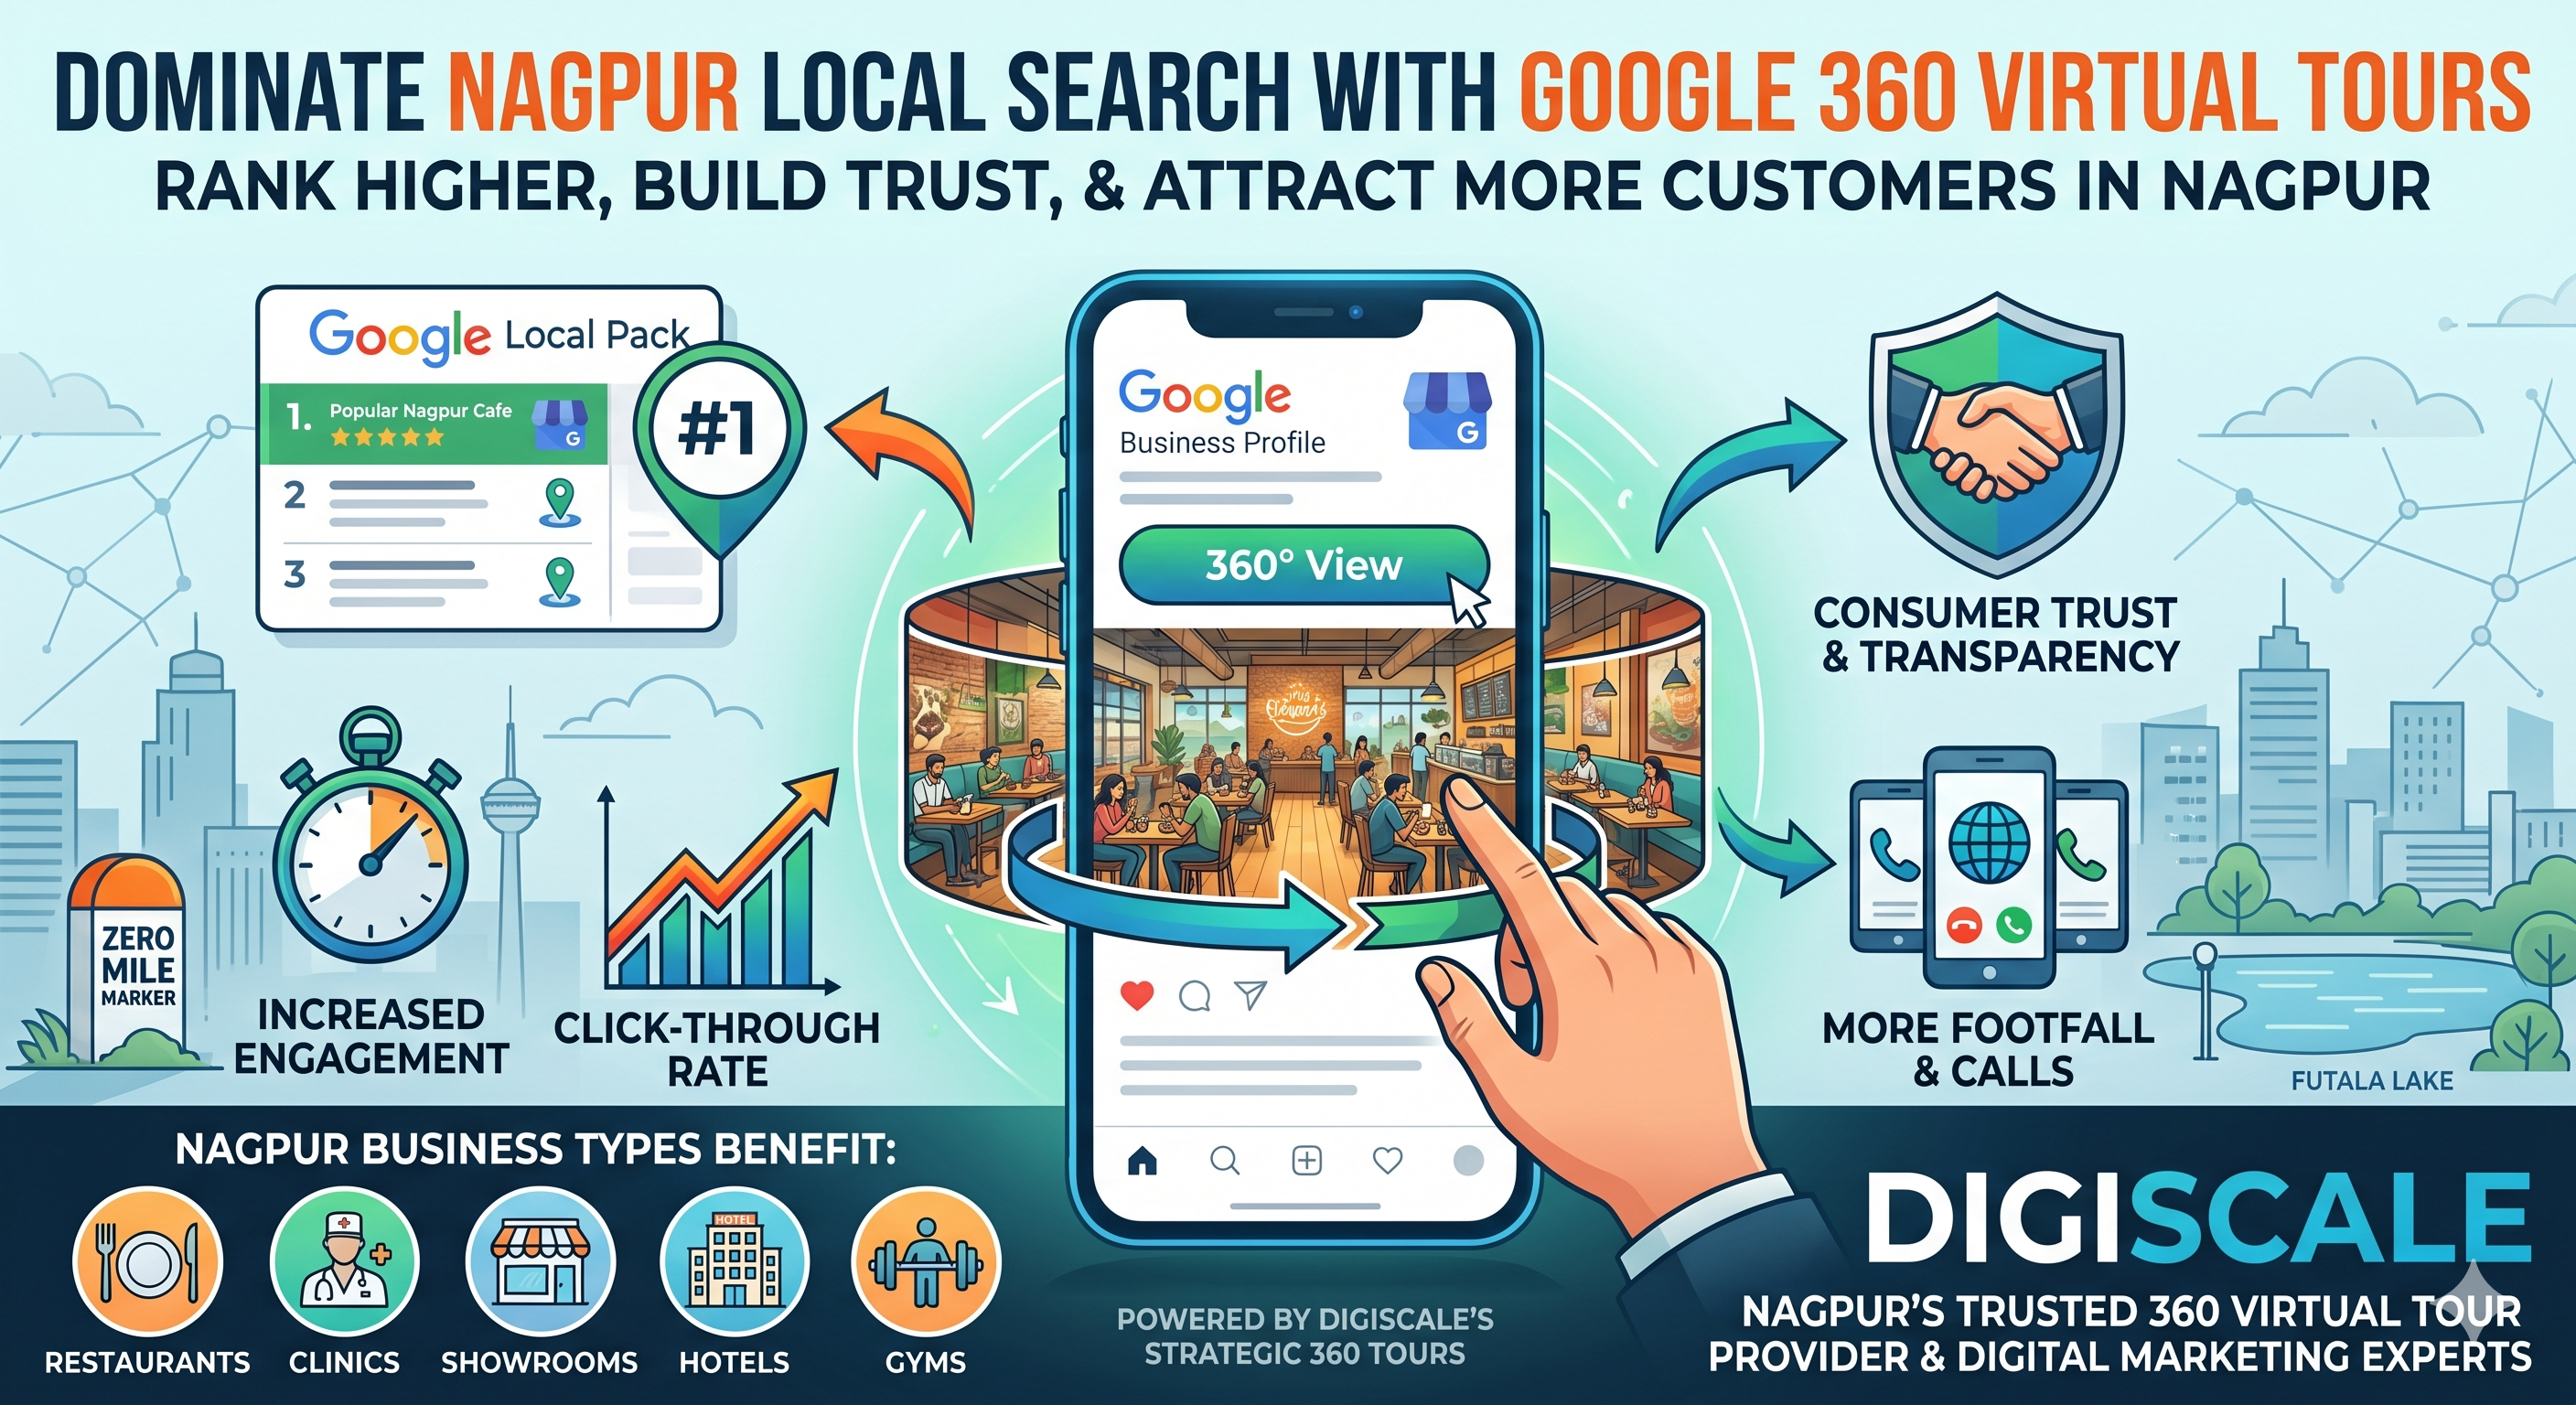
For businesses where the location and physical environment are part of the value proposition — restaurants, hotels, event venues, clinics, and showrooms — adding a Google 360 Virtual Tour typically produces a measurable increase in direction requests.
The tour converts passive profile visitors into people who are already mentally committed to visiting before they click directions.
4. Phone Calls
The number of times someone tapped the phone number on your Business Profile to call.
This is the second clearest conversion signal after direction requests.
What to do with it:
Track when call volume peaks during the week and what happens to it when you publish new Google Posts or add new photos.
These patterns tell you which profile activity is driving action.
For service businesses in Nagpur — lawyers, consultants, repair services, and agencies — this metric is often the primary conversion goal.
5. Website Clicks
The number of clicks to your website from your Business Profile.
For businesses that convert primarily through their website — e-commerce, booking-based services, and informational services — this is the most important metric.
A declining website click number from your GBP despite stable or growing views means the profile is not compelling enough to drive traffic to your website.
This is typically a photo, review score, or listing completeness problem.
6. Photo Views vs. Photo Count
Google Business Profile Performance also tracks how many times your photos have been viewed compared to competitor photos.
A listing where your photos are viewed significantly less than the category average signals that the photo content itself is less engaging — lower quality, fewer images, or less relevant content.
This is another area where a Google 360 Virtual Tour from Digiscale creates a significant advantage.
Virtual tour content consistently outperforms static photos in view time and engagement metrics because it is interactive and immersive rather than passive.
This shows the clear benefits of a virtual tour for businesses looking to stand out.
📈 How to Read Your Performance Data Strategically
Looking at individual metrics in isolation misses the bigger picture.
The strategic reading of your GBP Performance data involves understanding the funnel.
Views lead to engagement.
If views are high but direction requests and calls are low, the profile is being found but is not converting.
The problem is in the profile content — photos, reviews, virtual tour, and listing completeness.
Engagement leads to visits.
If direction requests are high but you are not seeing a corresponding increase in actual footfall, the problem might be expectations not matching reality.
This is often a photos issue, where the in-store experience does not match what was shown on the profile.
The benchmark question is always:
How does my profile performance compare to similar businesses in Nagpur in my category?
Digiscale provides this competitive benchmarking for clients as part of our Google Business Profile management service.
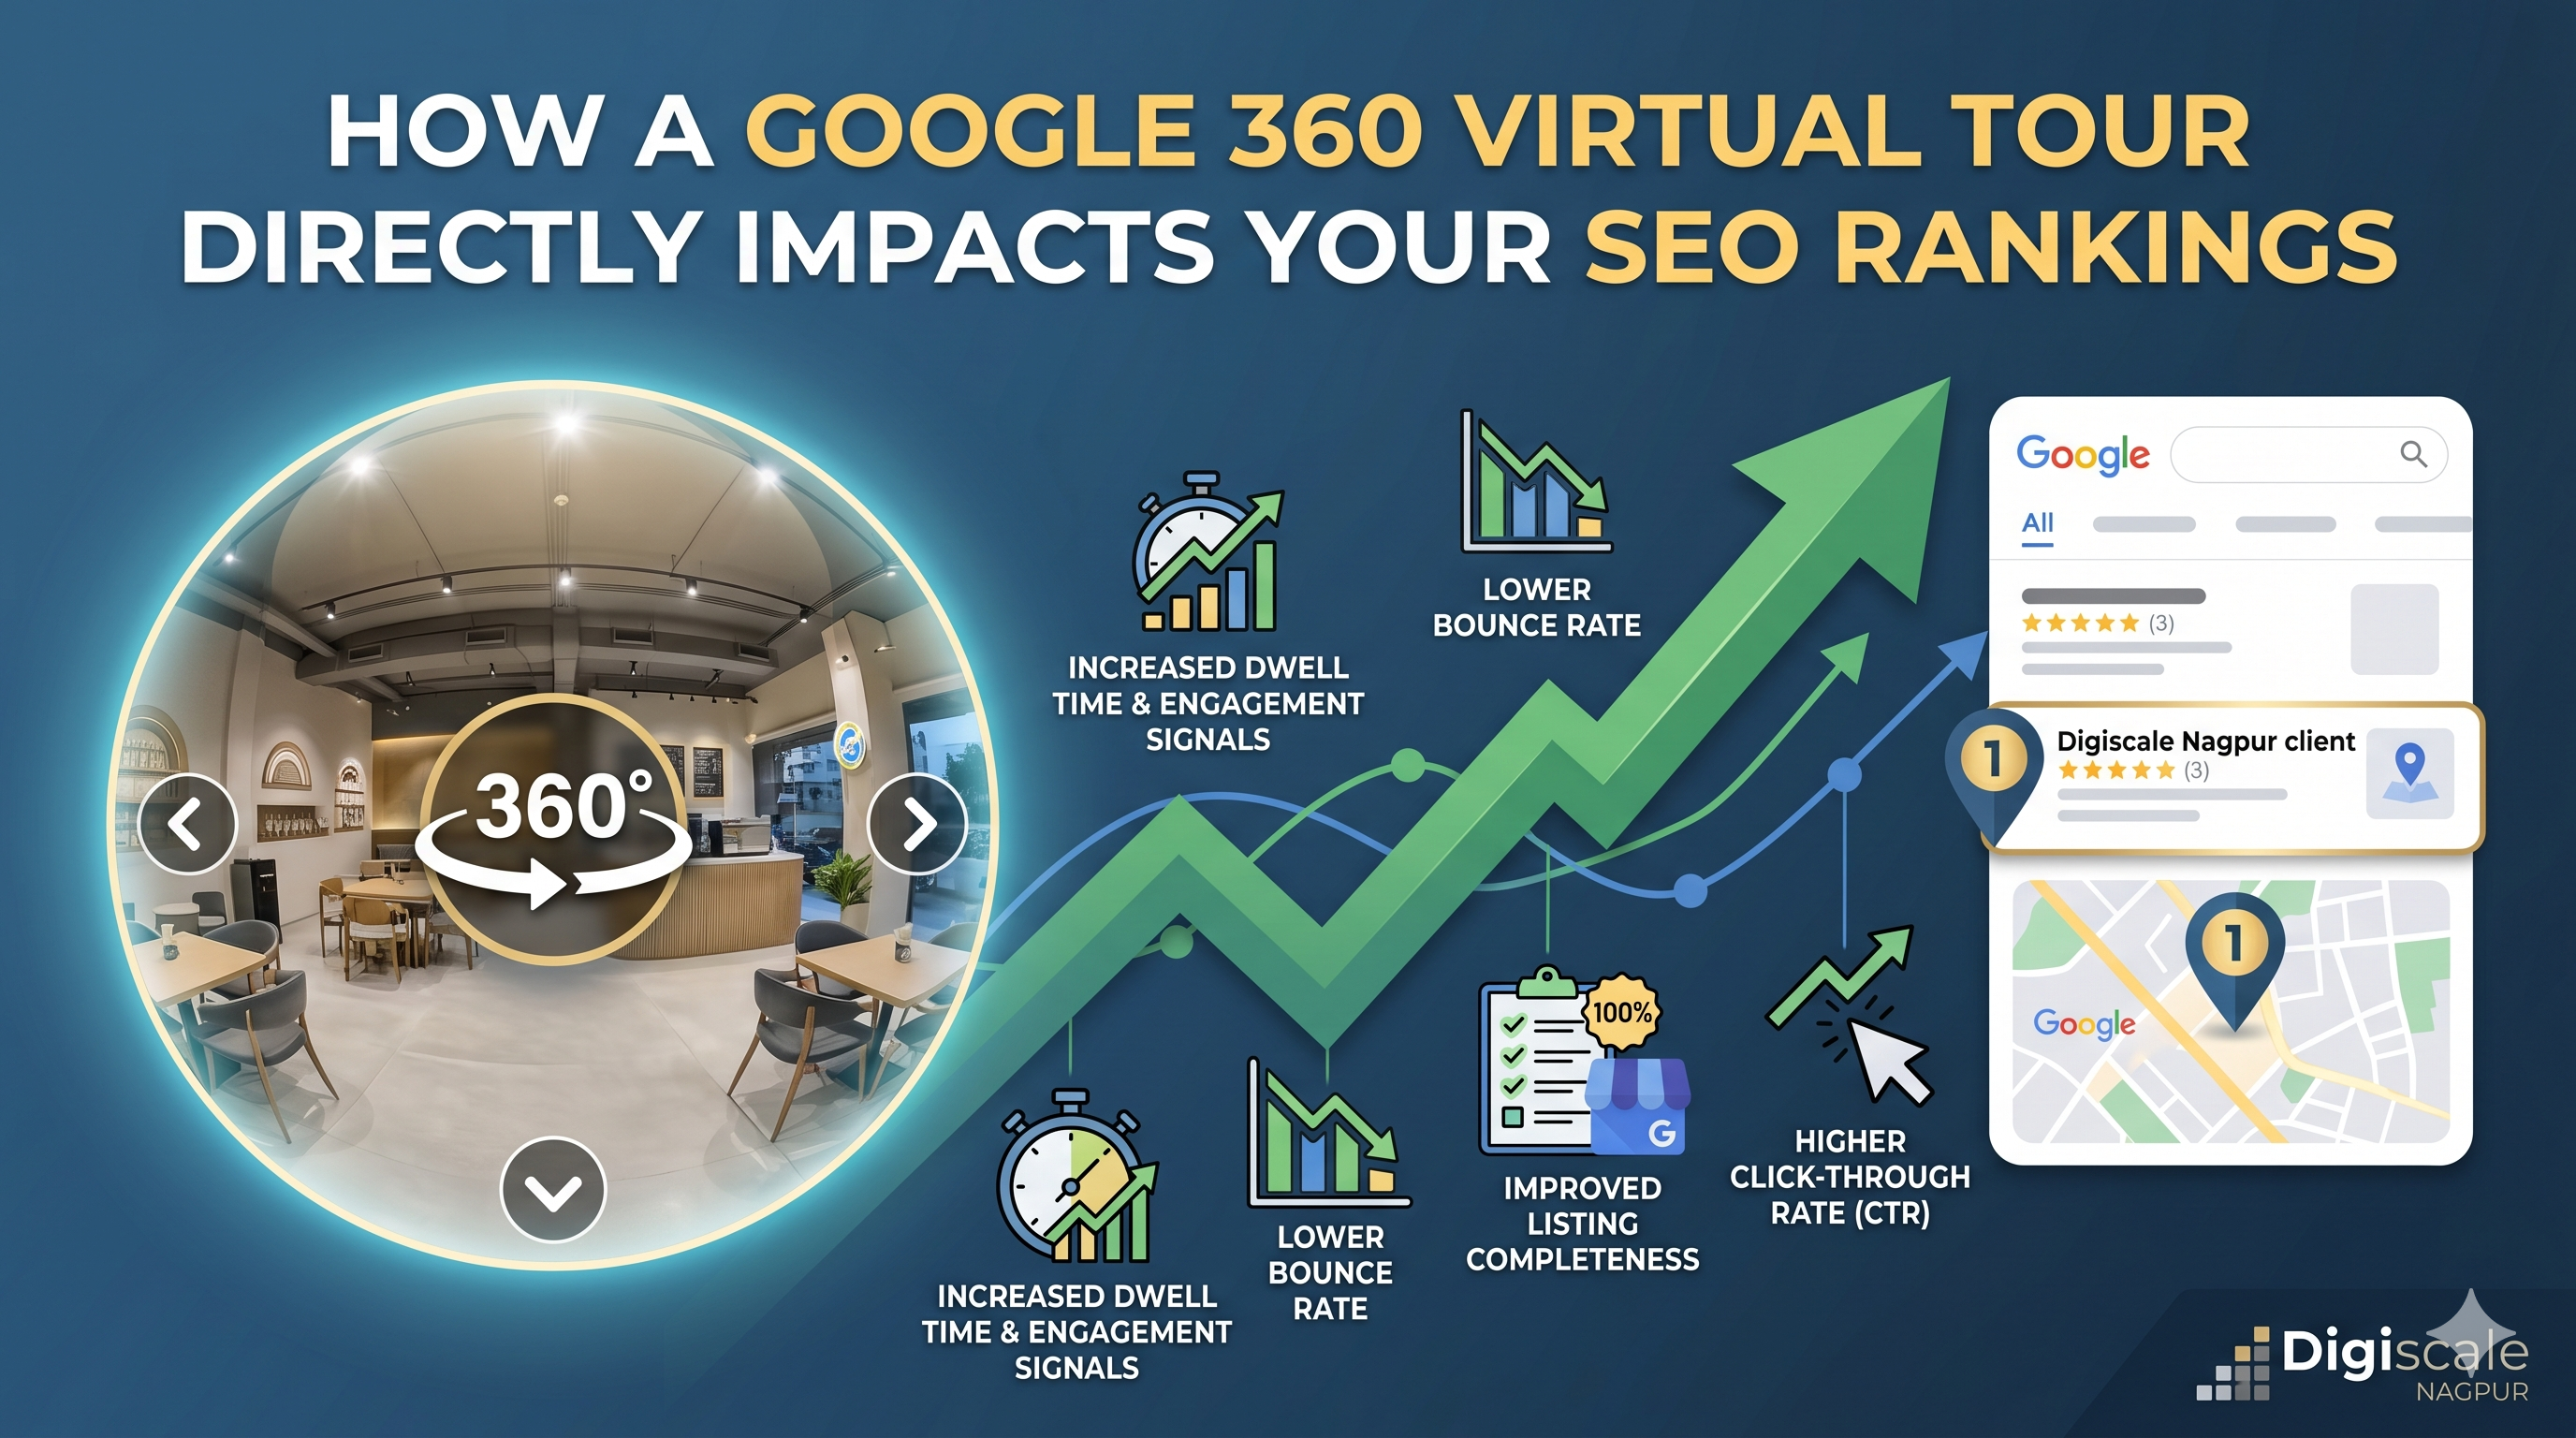
🧠 The Role of Google 360 Virtual Tours in Performance Metrics
When Digiscale adds a Google 360 Virtual Tour to a Business Profile, the measurable effect on performance metrics is consistently positive and often dramatic.
Photo views increase immediately.
The 360 tour content is surfaced prominently on Google Maps and in Search.
Users who encounter it spend significantly more time on the profile because the content is interactive.
This extended engagement time is registered as a behavioural signal by Google's algorithm.
Direction requests typically increase within the first thirty to sixty days of a tour going live.
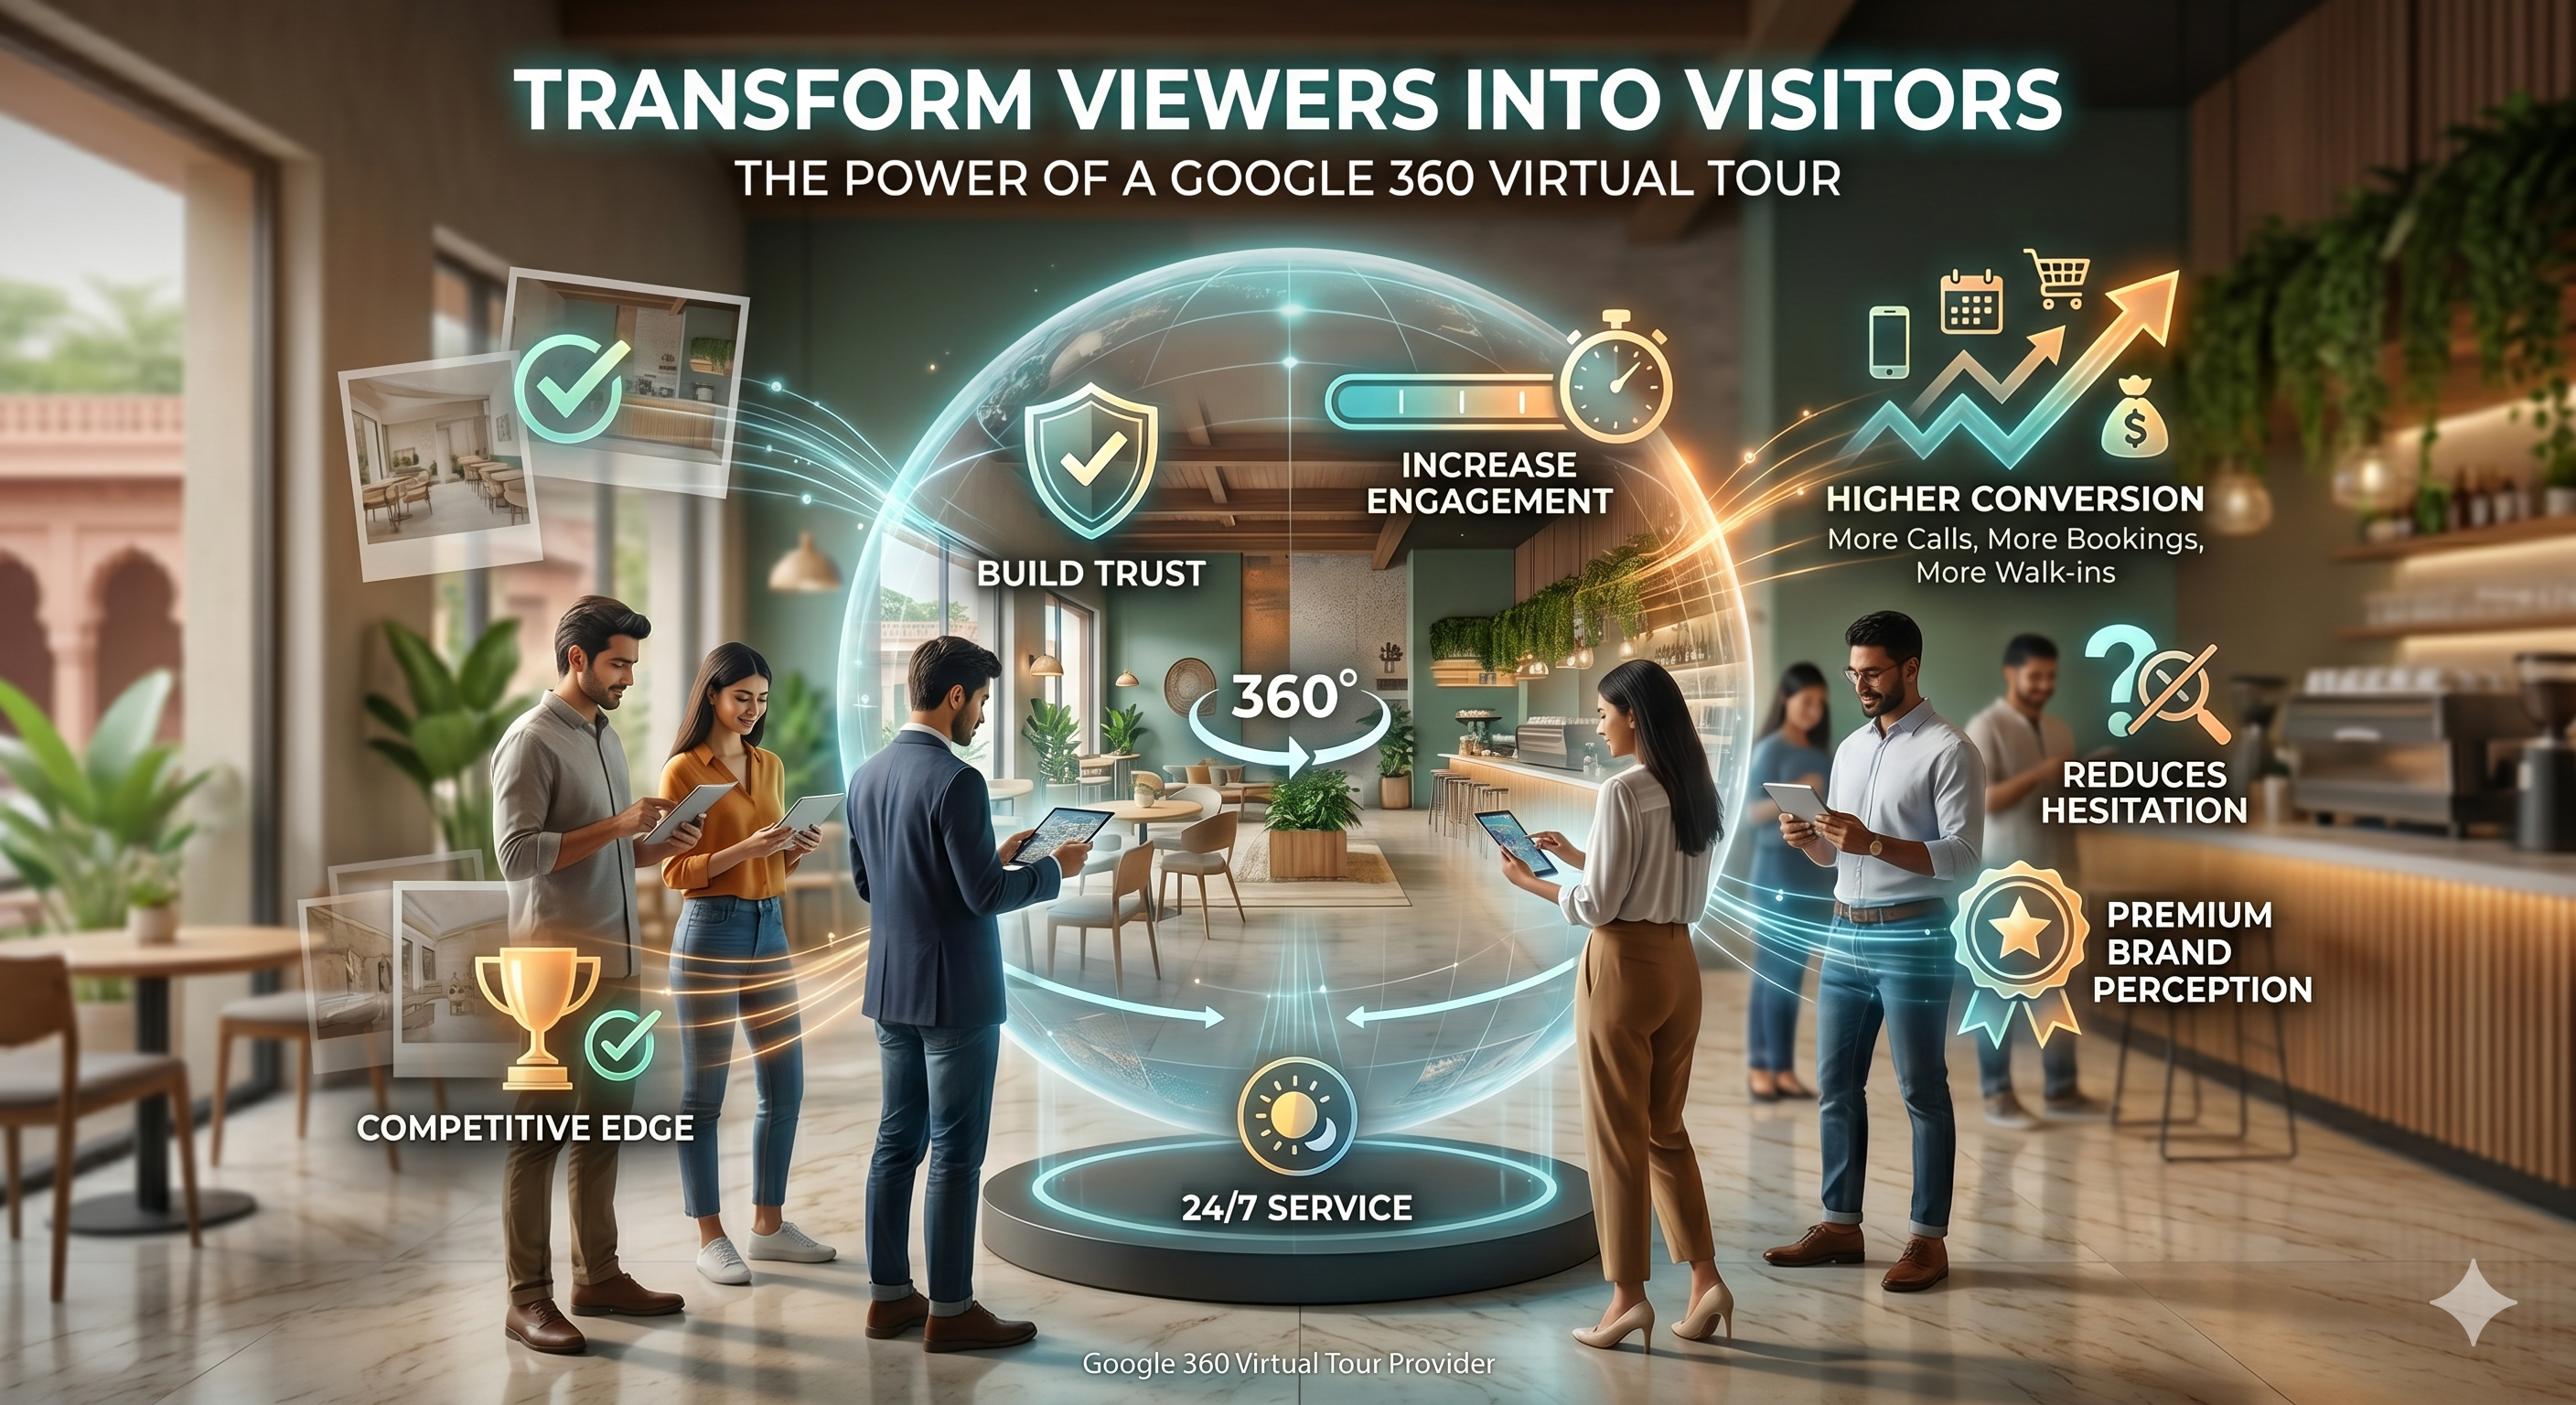
The tour achieves something static photos cannot.
It gives the user the feeling of having already visited.
That psychological familiarity converts to physical intent.
People request directions to places they already feel comfortable visiting.
For businesses in Nagpur where the physical space is core to the brand experience — restaurants, hotels, clinics, event venues, and educational institutes — the 360 virtual tour is not just a nice addition to the profile.
It is the single highest-impact update you can make to your performance data.
If you want to understand how a Google 360 Virtual Tour directly impacts SEO rankings, read our detailed guide.
⚙️ Setting Up a Monthly Review Habit
The businesses in Nagpur that use their GBP Performance data most effectively treat it like a financial dashboard.
They check it on the same day every month, track the key metrics, compare to the previous period, and ask three questions:
What grew?
What declined?
What does each change tell me about what I should do this month?
This does not require a marketing degree or a data analyst.
It requires twenty minutes once a month and the habit of taking one action in response to what the data shows.
📢 Final Thoughts — The Data Is Already There. Most Businesses Just Ignore It.
Google Business Profile Performance data is one of the few marketing dashboards that directly shows how customers discover, evaluate, and interact with your business.
The businesses that pay attention to these metrics make better decisions. They understand what is working, what is not, and where the next opportunity for growth exists.
You do not need complicated software or advanced analytics tools.
You simply need the habit of checking the data, understanding what it means, and acting on what it tells you.
Digiscale helps businesses across Nagpur understand, improve, and grow their Google Business Profile performance through optimization, review strategies, local SEO, and Google 360 Virtual Tours.
Check out our complete guide to virtual tours to see how you can elevate your business.
Contact Digiscale today for a free Google Business Profile audit and discover what your data is really telling you.
Frequently Asked Questions
How do I access Google Business Profile Performance data?
Sign in to your Google account, go to business.google.com or search for your business name on Google while signed in, click on your profile, and navigate to the Performance section. The data is updated regularly and shows the last six months by default, but you can adjust the date range.